GF delivers Excellence in Flow through essential products and solutions that enable the safe and sustainable transport of fluids worldwide. As part of its strategic transformation, GF divested GF Machining Solutions on 30 June 2025 and has signed an agreement to divest its GF Casting Solutions division. Headquartered in Switzerland, GF employs about 15’700 professionals and is present in 46 countries. GF generated sales of CHF 4’776 million in 2024. GF is listed on the SIX Swiss Exchange.
Sales per region (CHF 4'776 million) in %
- 29% 欧洲其他地区
- 26% 美洲
- 18% 中国
- 13% 德国
- 5% 亚洲其他地区
- 5% 世界其他地区
- 4% 瑞士
Gross value added per region (CHF 1'892 million) in %
- 26% 瑞士
- 24% 欧洲其他地区
- 23% 美洲
- 12% 中国
- 9% 德国
- 3% 亚洲其他地区
- 3% 世界其他地区
| CHF million | 2024 | 2023 |
|---|---|---|
| Order intake | 4'634 | 3'938 |
| Orders on hand | 723 | 827 |
| Sales | 4'776 | 4'026 |
| Sales growth % | 18.6 | 0.7 |
| Organic growth % | -2.6 | 3.7 |
| EBITDA (comparable)¹ | 618 | 511 |
| EBITDA margin (comparable)¹ % | 12.9 | 12.7 |
| EBITDA | 560 | 486 |
| EBITDA margin % | 11.7 | 12.1 |
| EBIT (comparable)¹ | 449 | 389 |
| EBIT margin (comparable)¹ % | 9.4 | 9.7 |
| EBIT | 389 | 365 |
| EBIT margin % | 8.1 | 9.1 |
| Net profit shareholders GF | 214 | 235 |
| Basic earnings per share in CHF | 2.61 | 2.87 |
| Free cash flow before acquisitions/divestments |
184 | 134 |
| Invested capital (IC) | 1'859 | 1'707 |
| Return on invested capital (ROIC) (comparable)¹ % | 19.9 | 21.5 |
| Return on invested capital (ROIC) % | 17.2 | 19.8 |
| Net debt (+)/Net cash (-) | 1'892 | 1'879 |
| Number of employees | 19'023 | 19'824 |
¹Without PPA effects on inventory and items affecting comparability.
GF工业与市政流体解决方案
GF工业与市政流体解决方案是全球领先的液体运输解决方案提供商,致力于以安全而可持续的方式运输液体,搭建生活”动脉“。该事业部专注于系统化解决方案,以及适用于多样化的安装基座的优质塑料和金属部件。配件、阀门、管道的产品组合、自动化和连接技术涵盖水循环应用的各个领域。
Sales per segment (CHF 1'971 million) in %
- 45% 工业
- 35% 公用事业
- 20% 建筑技术
| CHF million | 2024 | 2023 |
|---|---|---|
| Order intake | 1'905 | 1'954 |
| Orders on hand at year end | 246 | 300 |
| Sales | 1'971 | 2'066 |
| Sales growth % | -4.6 | -4.4 |
| Organic growth % | -3.7 | 3.0 |
| EBITDA (comparable)¹ | 307 | 327 |
| EBITDA margin (comparable)¹ % | 15.6 | 15.8 |
| EBITDA | 293 | 327 |
| EBITDA margin % | 14.9 | 15.8 |
| EBIT (comparable)¹ | 250 | 275 |
| EBIT margin (comparable)¹ % | 12.7 | 13.3 |
| EBIT | 234 | 275 |
| EBIT margin % | 11.9 | 13.3 |
| Invested capital (IC) | 838 | 758 |
| Return on invested capital (ROIC) % | 24.9 | 31.1 |
| Number of employees | 8'309 | 8'798 |
¹Without PPA effects on inventory and items affecting comparability.
GF楼宇方案
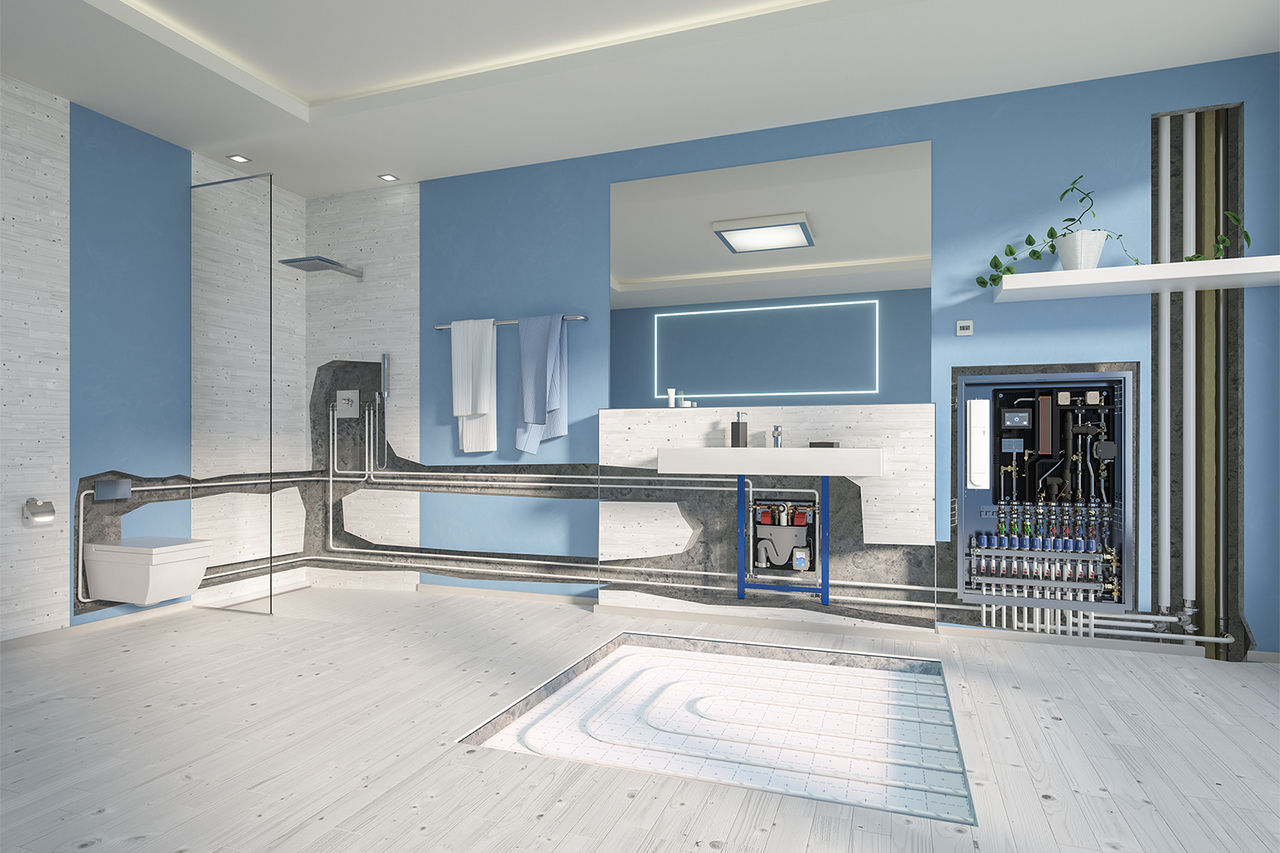
GF楼宇方案是全球领先的解决方案供应商,为城市、建筑物和家庭提供安全高效的水输送解决方案。该事业部提供安全的饮用水,节能的辐射供暖和制冷系统,以及可靠的基础设施解决方案,帮助住宅和商用建筑、市政以及公用事业领域的客户提高生产效率,并不断寻找可靠地节约、管理和输送水资源的新方法,释放水资源的潜力,为人们提供舒适、健康和高效能的生活。
Sales per segment (CHF 1'083 million) in %
- 43% 楼宇解决方案 - 北美
- 39% 楼宇解决方案 - 欧洲
- 18% 市政与工业解决方案
| CHF million | 2024 | 2023² |
|---|---|---|
| Order intake | 1'051 | 167 |
| Orders on hand | 36 | 47 |
| Sales | 1'083 | 164 |
| Sales growth % | n/a | |
| Organic growth % | 1.0 | |
| EBITDA (comparable)¹ | 157 | 19 |
| EBITDA margin (comparable)¹ % | 14.5 | 11.3 |
| EBITDA | 135 | -6 |
| EBITDA margin % | 12.4 | -3.7 |
| EBIT (comparable)¹ | 112 | 11 |
| EBIT margin (comparable)¹ % | 10.3 | 6.9 |
| EBIT | 88 | -13 |
| EBIT margin % | 8.1 | -8.2 |
| Invested capital (IC) | 330 | 365 |
| Return on invested capital (ROIC) % | 17.7 | n/a |
| Number of employees | 3'663 | 3'687 |
¹Without PPA effects on inventory and items affecting comparability.
²Only covers the months of November and December.
GF成型方案
GF成型方案是交通和能源行业轻量化组件的领先解决方案提供商之一。作为一家面向未来的公司,我们努力推动铸造和增材制造领域的创新,并致力于在开发和制造创新节能的轻量化解决方案方面发挥带头作用。
Sales per segment (CHF 841 million) in %
- 75% 汽车
- 12% 工业应用
- 13% 航空/能源
| CHF million | 2024 | 2023 |
|---|---|---|
| Order intake | 832 | 912 |
| Orders on hand | 262 | 269 |
| Sales | 841 | 910 |
| Sales growth % | -7.6 | 2.0 |
| Organic growth % | -5.6 | 11.4 |
| EBITDA (comparable)¹ | 96 | 104 |
| EBITDA margin (comparable)¹ % | 11.5 | 11.4 |
| EBITDA | 82 | 104 |
| EBITDA margin % | 9.8 | 11.4 |
| EBIT (comparable)¹ | 56 | 64 |
| EBIT margin (comparable)¹ % | 6.7 | 7.0 |
| EBIT | 42 | 64 |
| EBIT margin % | 5.0 | 7.0 |
| Invested capital (IC) | 355 | 315 |
| Return on invested capital (ROIC) % | 12.8 | 17.6 |
| Number of employees | 3'586 | 3'792 |
¹Without items affecting comparability.
GF加工方案
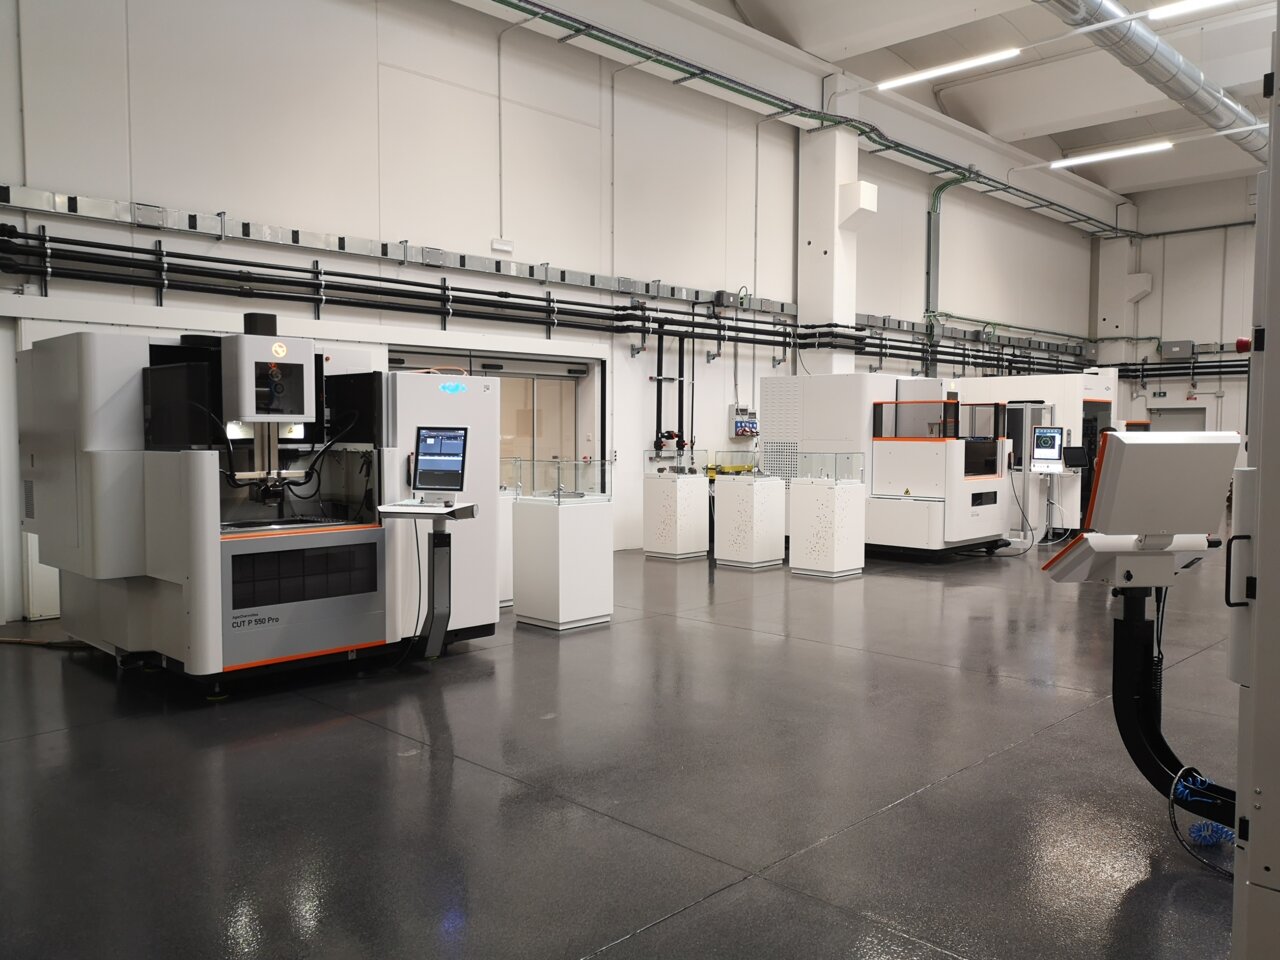
GF加工方案是世界领先的,为工具和模具制造行业及精密零件加工提供完整解决方案的的供应商之一。产品包括铣削和 EDM 机。该事业部还提供主轴、激光纹理、激光微加工、增材制造、自动化和工具,以及数字化解决方案。
Sales per segment (CHF 885 million) in %
- 33% 铣销加工
- 29% 客户服务
- 23% EDM
- 15% 高级制造/ 自动化与工具
| CHF million | 2024 | 2023 |
|---|---|---|
| Order intake | 848 | 907 |
| Orders on hand | 180 | 211 |
| Sales | 885 | 887 |
| Sales growth % | -0.2 | -6.5 |
| Organic growth % | 2.4 | -1.9 |
| EBITDA (comparable)¹ | 70 | 75 |
| EBITDA margin (comparable)¹ % | 7.9 | 8.4 |
| EBITDA | 66 | 75 |
| EBITDA margin % | 7.5 | 8.4 |
| EBIT (comparable)¹ | 52 | 60 |
| EBIT margin (comparable)¹ % | 5.9 | 6.8 |
| EBIT | 49 | 60 |
| EBIT margin % | 5.5 | 6.8 |
| Invested capital (IC) | 258 | 267 |
| Return on invested capital (ROIC) % | 16.4 | 22.9 |
| Number of employees | 3'289 | 3'377 |
¹Without items affecting comparability.


