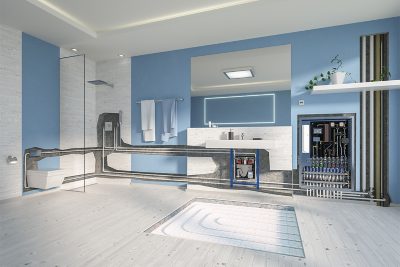
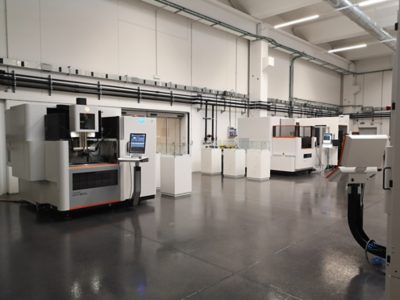
GF, with a rich history in industrial innovation, is actively reshaping itself to become the global leader in Flow Solutions for Industry, Infrastructure and Buildings. With its divisions, GF Piping Systems and GF Building Flow Solutions, GF delivers essential products and solutions that enable the safe and efficient transport of liquids and gases worldwide. As part of its strategic transformation, GF is divesting its GF Machining Solutions division and is evaluating strategic options for its GF Casting Solutions division. Founded in 1802, GF is headquartered in Switzerland and present in 46 countries with 184 companies, 74 of which are production companies as per end of 2024. GF employs about 19’000 professionals and generated sales of CHF 4’776 million in 2024. GF is listed on the Swiss stock exchange.
Sales per region (CHF 4'776 million) in %
- 29% Rest of Europe
- 26% Americas
- 18% China
- 13% Germany
- 5% Rest of Asia
- 5% Rest of world
- 4% Switzerland
Gross value added per region (CHF 1'892 million) in %
- 26% Switzerland
- 24% Rest of Europe
- 23% Americas
- 12% China
- 9% Germany
- 3% Rest of Asia
- 3% Rest of world
| CHF million | 2024 | 2023 |
|---|---|---|
| Order intake | 4'634 | 3'938 |
| Orders on hand | 723 | 827 |
| Sales | 4'776 | 4'026 |
| Sales growth % | 18.6 | 0.7 |
| Organic growth % | -2.6 | 3.7 |
| EBITDA (comparable)¹ | 618 | 511 |
| EBITDA margin (comparable)¹ % | 12.9 | 12.7 |
| EBITDA | 560 | 486 |
| EBITDA margin % | 11.7 | 12.1 |
| EBIT (comparable)¹ | 449 | 389 |
| EBIT margin (comparable)¹ % | 9.4 | 9.7 |
| EBIT | 389 | 365 |
| EBIT margin % | 8.1 | 9.1 |
| Net profit shareholders GF | 214 | 235 |
| Basic earnings per share in CHF | 2.61 | 2.87 |
| Free cash flow before acquisitions/divestments |
184 | 134 |
| Invested capital (IC) | 1'859 | 1'707 |
| Return on invested capital (ROIC) (comparable)¹ % | 19.9 | 21.5 |
| Return on invested capital (ROIC) % | 17.2 | 19.8 |
| Net debt (+)/Net cash (-) | 1'892 | 1'879 |
| Number of employees | 19'023 | 19'824 |
¹Without PPA effects on inventory and items affecting comparability.
GF Piping Systems
As the leading flow solutions provider for the safe and sustainable transport of fluids, GF Piping Systems creates connections for life. The division focuses on industry-leading leak-free piping solutions for numerous demanding end-market segments.
Sales per segment (CHF 1'971 million) in %
- 45% Industry
- 35% Utility
- 20% Building Technology
| CHF million | 2024 | 2023 |
|---|---|---|
| Order intake | 1'905 | 1'954 |
| Orders on hand | 246 | 300 |
| Sales | 1'971 | 2'066 |
| Sales growth % | -4.6 | -4.4 |
| Organic growth % | -3.7 | 3.0 |
| EBITDA (comparable)¹ | 307 | 327 |
| EBITDA margin (comparable)¹ % | 15.6 | 15.8 |
| EBITDA | 293 | 327 |
| EBITDA margin % | 14.9 | 15.8 |
| EBIT (comparable)¹ | 250 | 275 |
| EBIT margin (comparable)¹ % | 12.7 | 13.3 |
| EBIT | 234 | 275 |
| EBIT margin % | 11.9 | 13.3 |
| Invested capital (IC) | 838 | 758 |
| Return on invested capital (ROIC) % | 24.9 | 31.1 |
| Number of employees | 8'309 | 8'798 |
¹Without PPA effects on inventory and items affecting comparability.
GF Building Flow Solutions
GF Building Flow Solutions is a leading global provider of solutions that efficiently and effectively move water through cities, buildings, and homes. The division provides safe drinking water, energy-efficient radiant heating and cooling systems as well as reliable infrastructure solutions. It helps customers in residential and commercial construction, municipalities, and utilities, be more productive – and continuously find new ways to conserve, manage and provide water responsibly, unlocking its potential to provide comfort, health, and efficiency.
Sales per segment (CHF 1'083 million) in %
- 43% Building Solutions - North America
- 39% Building Solutions - Europe
- 18% Infrastructure Solutions
| CHF million | 2024 | 2023² |
|---|---|---|
| Order intake | 1'051 | 167 |
| Orders on hand | 36 | 47 |
| Sales | 1'083 | 164 |
| Sales growth % | n/a | |
| Organic growth % | 1.0 | |
| EBITDA (comparable)¹ | 157 | 19 |
| EBITDA margin (comparable)¹ % | 14.5 | 11.3 |
| EBITDA | 135 | -6 |
| EBITDA margin % | 12.4 | -3.7 |
| EBIT (comparable)¹ | 112 | 11 |
| EBIT margin (comparable)¹ % | 10.3 | 6.9 |
| EBIT | 88 | -13 |
| EBIT margin % | 8.1 | -8.2 |
| Invested capital (IC) | 330 | 365 |
| Return on invested capital (ROIC) % | 17.7 | n/a |
| Number of employees | 3'663 | 3'687 |
¹Without PPA effects on inventory and items affecting comparability.
²Only covers the months of November and December.
GF Casting Solutions
GF Casting Solutions is one of the leading solution providers of lightweight components in the mobility and energy industries. As a future-oriented company, GF Casting Solutions acts as a driving force for innovation in the foundry and additive manufacturing world and aims to take the lead in developing and manufacturing innovative and energy-efficient lightweight solutions, empowering sustainable mobility.
Sales per segment (CHF 841 million) in %
- 75% Automotive
- 12% Industrial Applications
- 13% Aerospace/Energy
| CHF million | 2024 | 2023 |
|---|---|---|
| Order intake | 832 | 912 |
| Orders on hand | 262 | 269 |
| Sales | 841 | 910 |
| Sales growth % | -7.6 | 2.0 |
| Organic growth % | -5.6 | 11.4 |
| EBITDA (comparable)¹ | 96 | 104 |
| EBITDA margin (comparable)¹ % | 11.5 | 11.4 |
| EBITDA | 82 | 104 |
| EBITDA margin % | 9.8 | 11.4 |
| EBIT (comparable)¹ | 56 | 64 |
| EBIT margin (comparable)¹ % | 6.7 | 7.0 |
| EBIT | 42 | 64 |
| EBIT margin % | 5.0 | 7.0 |
| Invested capital (IC) | 355 | 315 |
| Return on invested capital (ROIC) % | 12.8 | 17.6 |
| Number of employees | 3'586 | 3'792 |
¹Without items affecting comparability.
GF Machining Solutions
GF Machining Solutions is one of the world's leading providers of complete solutions for precision components and tools manufacturers, and the mold-making industry. The portfolio includes milling, EDM, laser texturing, laser micromachining, and additive manufacturing machines.
Sales per segment (CHF 885 million) in %
- 33% Milling
- 29% Customer Service
- 23% EDM
- 15% Advanced Manufacturing/Automation & Tooling
| CHF million | 2024 | 2023 |
|---|---|---|
| Order intake | 848 | 907 |
| Orders on hand | 180 | 211 |
| Sales | 885 | 887 |
| Sales growth % | -0.2 | -6.5 |
| Organic growth % | 2.4 | -1.9 |
| EBITDA (comparable)¹ | 70 | 75 |
| EBITDA margin (comparable)¹ % | 7.9 | 8.4 |
| EBITDA | 66 | 75 |
| EBITDA margin % | 7.5 | 8.4 |
| EBIT (comparable)¹ | 52 | 60 |
| EBIT margin (comparable)¹ % | 5.9 | 6.8 |
| EBIT | 49 | 60 |
| EBIT margin % | 5.5 | 6.8 |
| Invested capital (IC) | 258 | 267 |
| Return on invested capital (ROIC) % | 16.4 | 22.9 |
| Number of employees | 3'289 | 3'377 |
¹Without items affecting comparability.


